Visual Communication in Social Media Crises: Design Principles That Reduce Misinterpretation
Build social media visuals for crisis moments with clarity, readability, and platform-safe layouts that protect brand trust.
Visuals Lead Before Text
In crisis moments, audiences react to the visual first and the statement second. If your layout feels promotional, cluttered, or unclear, even a responsible message can be perceived as insincere.
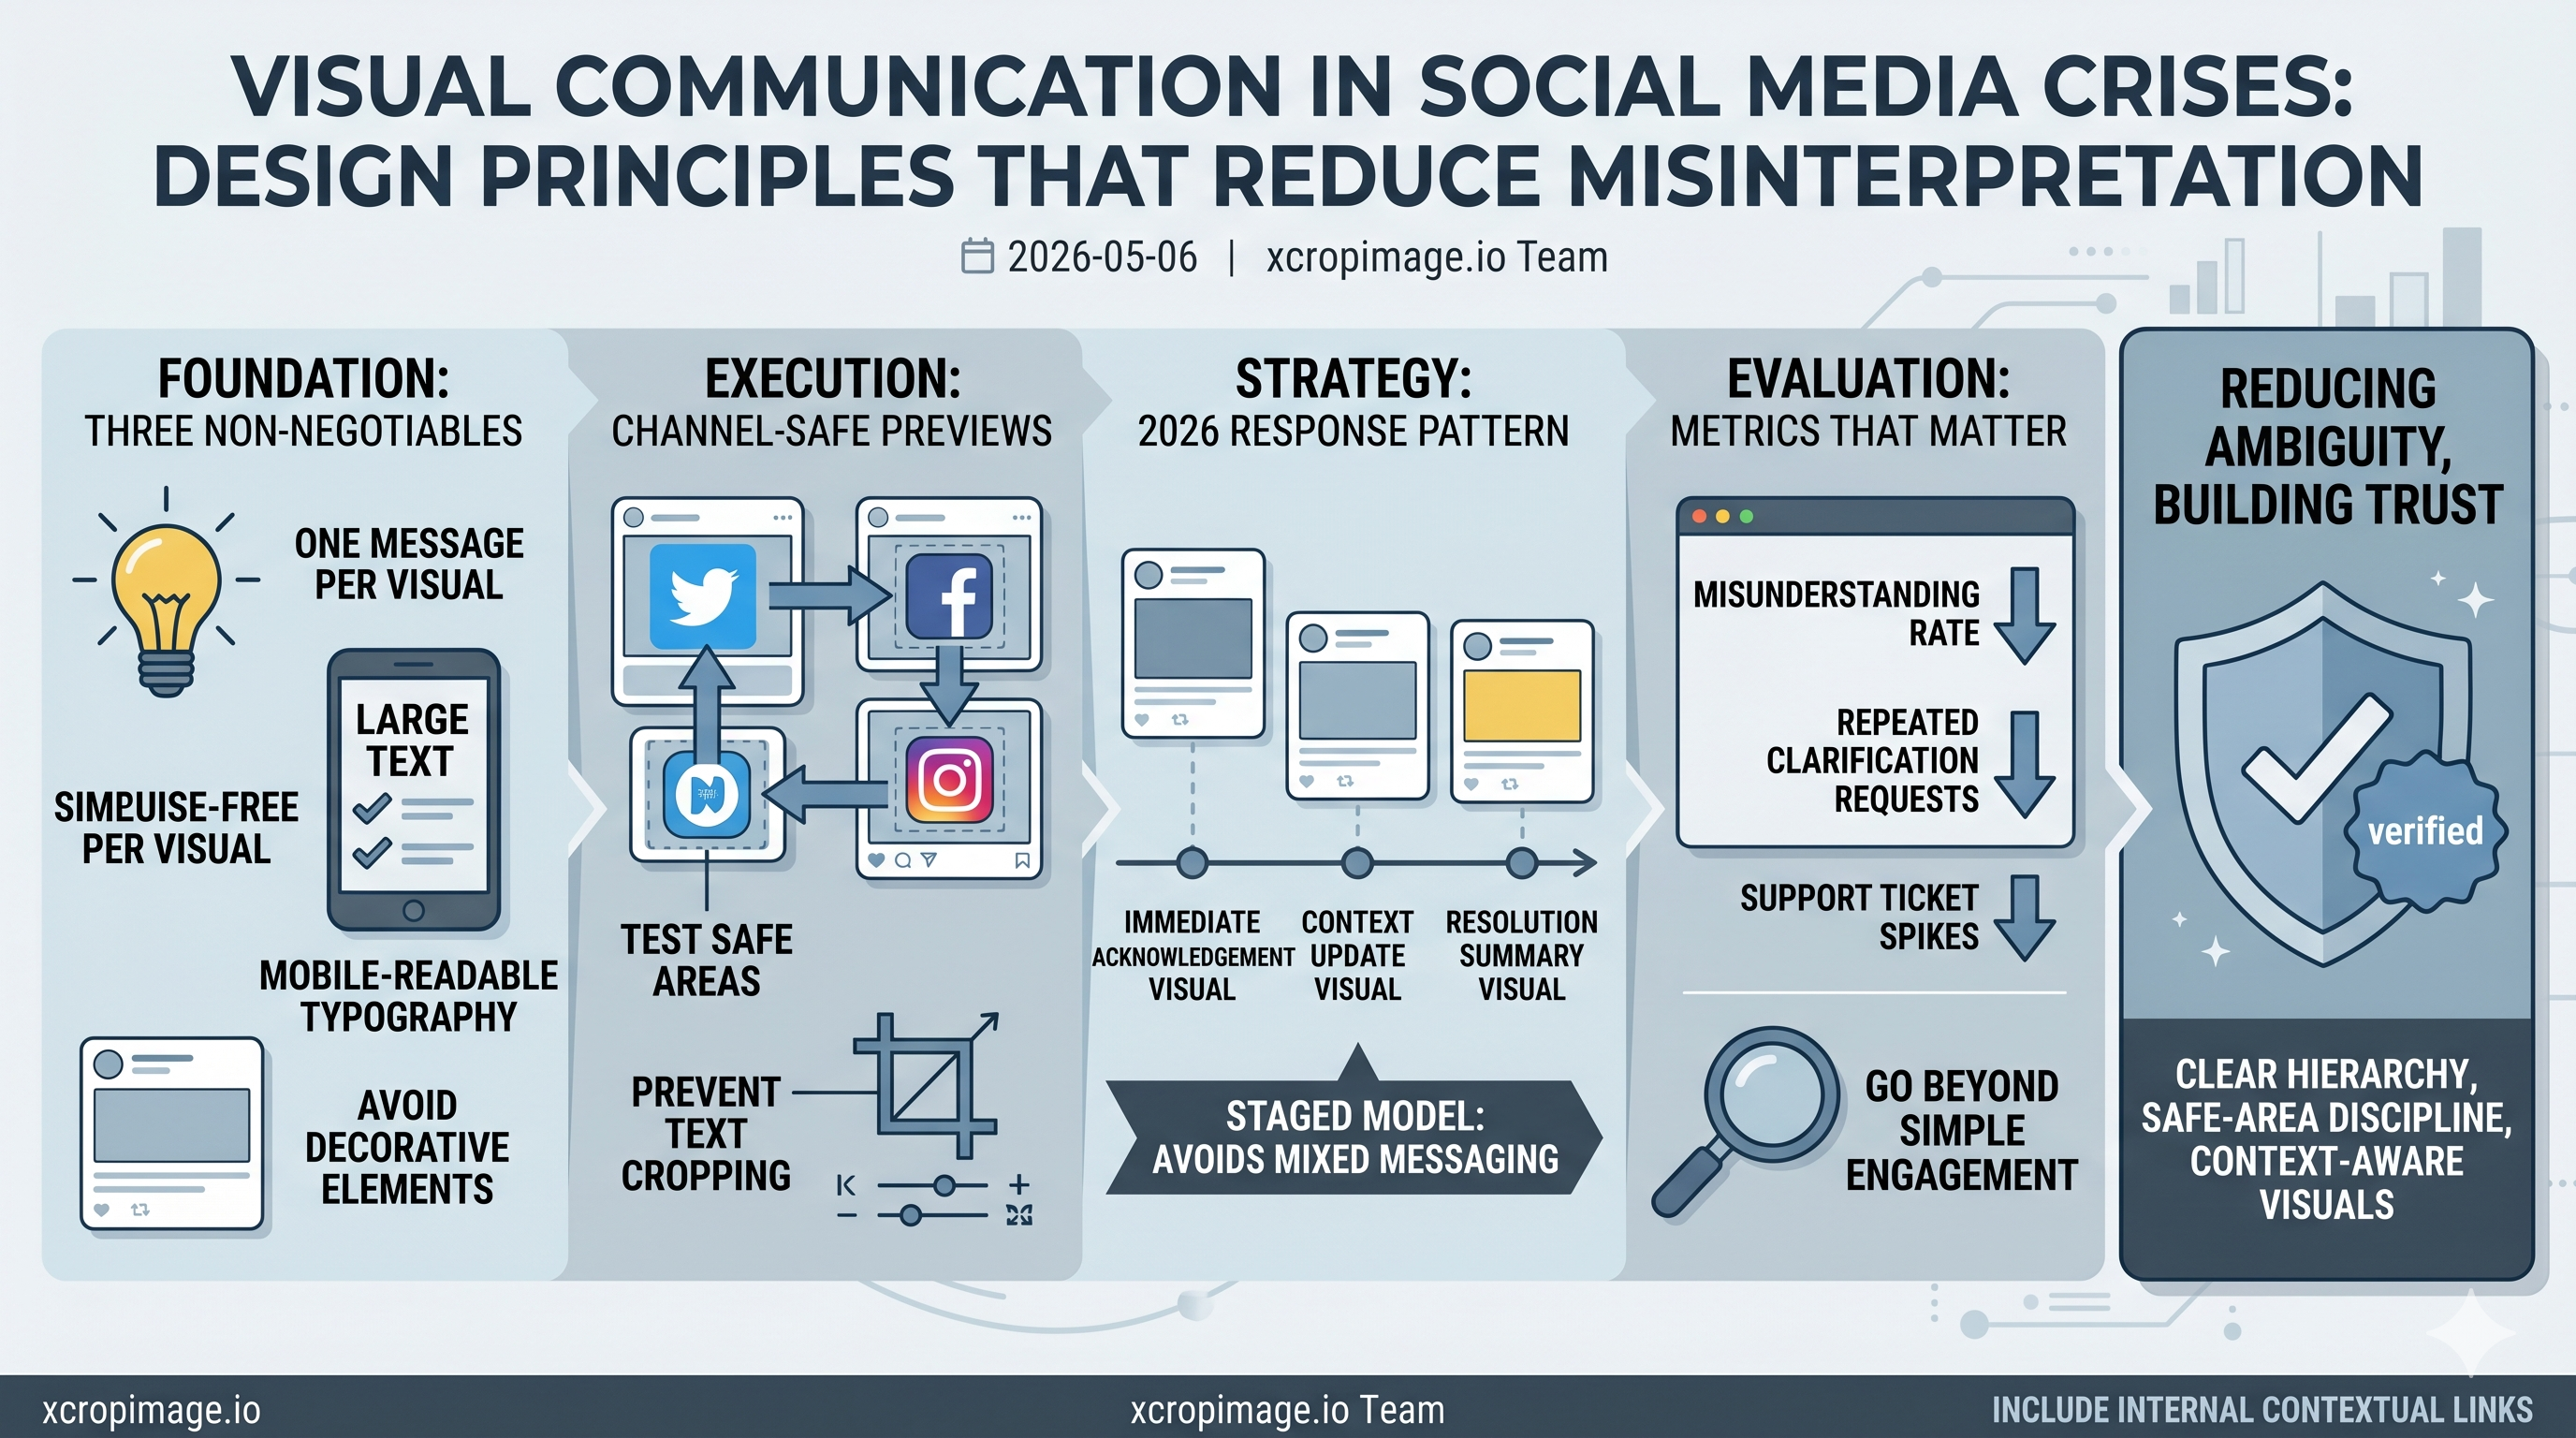
Three Non-Negotiables
Use one message per visual, keep typography readable on mobile, and avoid decorative elements that compete with the core statement.
If readability drops, trust drops. This article on text readability in ad visuals provides a practical contrast baseline you can adapt.
Channel-Safe Execution
Critical lines often get cropped in previews. Test safe areas before posting, especially when publishing across multiple channels. Use the image cropper for framing control and the image resizer for channel-specific outputs.
Internal Linking for Context
Crisis-related posts can still rank when structured well. Add useful internal references instead of generic links. For preview issues, link to Open Graph and Twitter Card debugging. For performance under traffic spikes, connect to simple image optimization tips.
Closing Thought
Crisis visuals are not about aesthetic experiments; they are about reducing ambiguity. Clear hierarchy, safe-area discipline, and context-aware links make your response faster and more trustworthy.
2026 Response Pattern Teams Use
High-performing teams now use a staged response model: immediate acknowledgement visual, context update visual, and resolution summary visual. This structure reduces confusion and avoids overloading a single card with mixed messaging.
Metrics That Matter in Crisis Content
Track misunderstanding rate, repeated clarification requests, and support ticket spikes in addition to engagement. If those operational metrics improve, your visual strategy is working. For recurring preview issues under pressure, keep Open Graph debugging in your internal playbook.